Ability to print stats from System Status page
New statistics section for session history
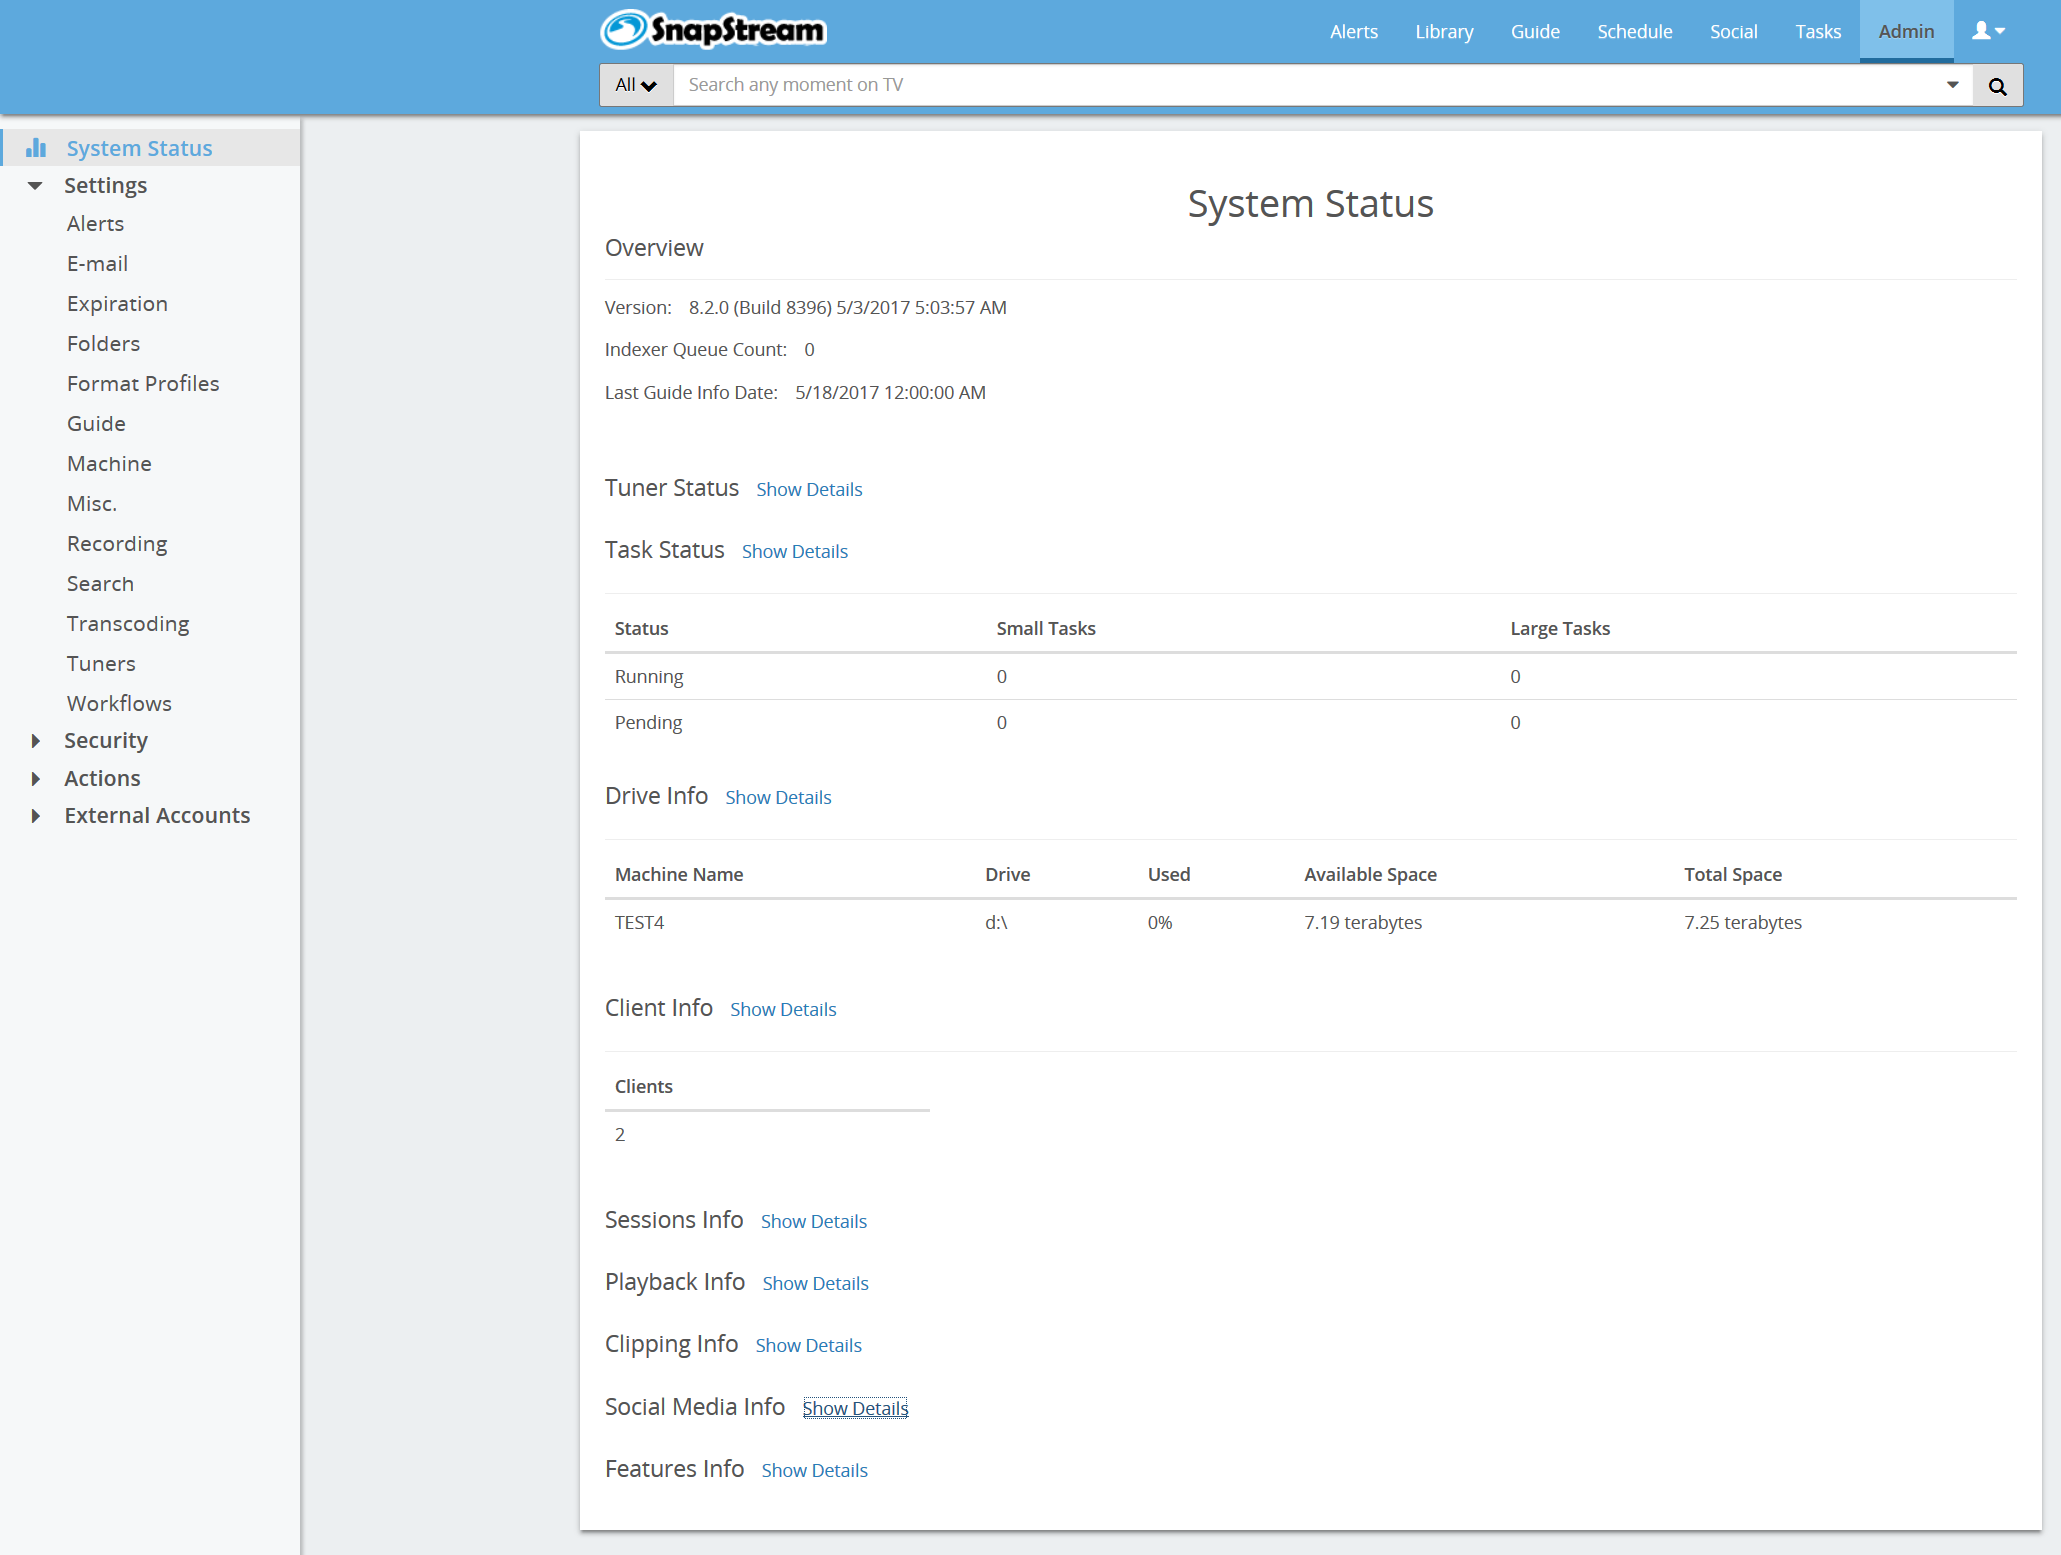
The System Status page gives detailed information about different components of a SnapStream cluster.
Click Show Details next to any heading to expand the section.
Overview
The section displays the software version, build number and release date, as well as:
Indexer Queue Count: The number of library items waiting to be indexed. This number should usually be close to 0. Last Guide Info Date: The date of the latest entry in the Program Guide. Usually this will be about two weeks in the future.
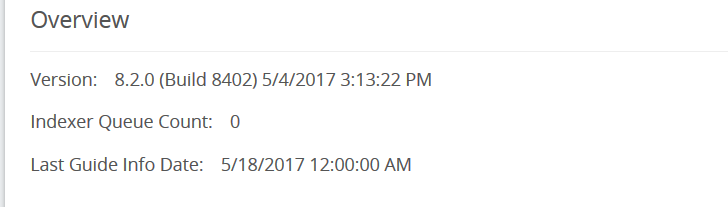
Tuner Status
This section lists all tuners available for new recordings, including the name of the tuner as specified in the tuner settings and the machine on which the physical tuning device is located, as well as status messages about each tuner.
TheDead Tunerssection lists any tuners that are not functioning properly and have been deactivated automatically.
If a tuner is disabled, theEnabled, AliveandSchedulingcolumns will readFalsefor that tuner.
Normally, theRecorder Manager Onlinecolumn will readTrue, regardless of tuner settings.
For any tuner, if any of these columns readsFalse, no new recordings can be made on that tuner.
Tuner problemscan be caused by a variety of hardware and software problems. ClickingResetmay correct an abnormal tuner state, or a False reading may indicate that a tuner is failing. If a tuner is listed as Dead, or if its Recorder Manager is offline, pleasecontact SnapStream Supportfor assistance.
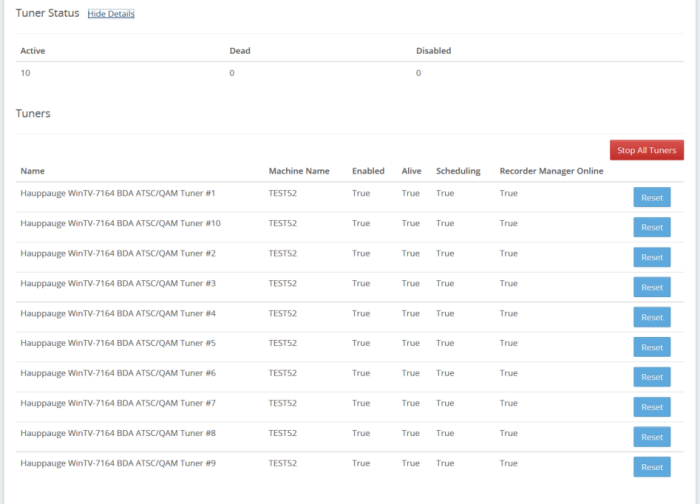
Task Status
This section lists the post-processing properties of each node in the server cluster.
Detailed Task Status:Lists specific information about the tasks that are currently running on each node in the server cluster.
TaskRunner Manager Online:Indicates a node's task manager is online. If this column reads False, the node will not process any tasks.
Allow Processor Intensive Tasks:Reports each node permitted to run tasks that require significant processing power. Configured on theLocal Settingspage.
Active Small Tasks: Reports the number of "Small" tasks, such as clipping and tagging tasks, as well as file moves, that are currently running.
Active Large Tasks:Reports the number "Large" tasks, such as transcoding and SmartChapter tasks, that are currently running.
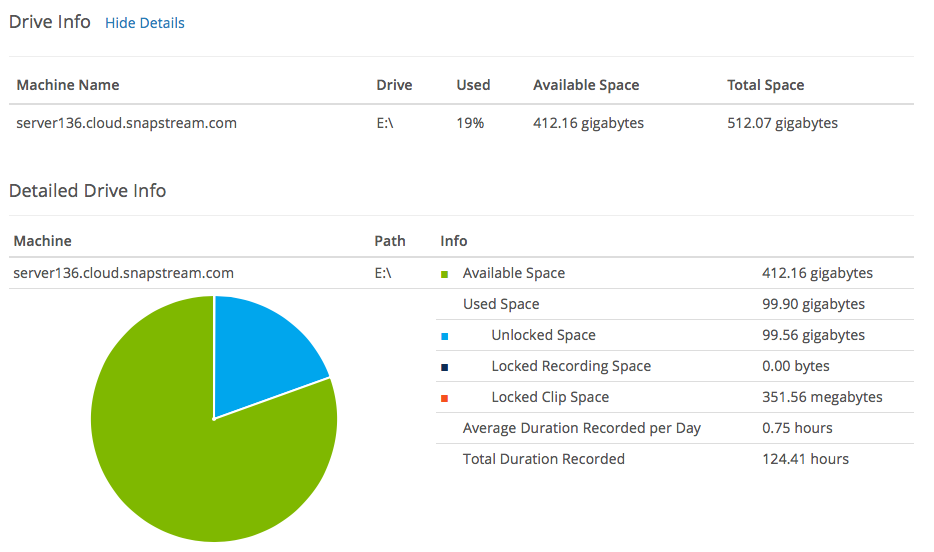
Drive Info Click Show Details to see your drive statistics:
Available Space: The amount of space on this disk that is currently available to SnapStream.
Used Space: This number indicates the total amount of data on the drive that is part of the SnapStream library. Data that is located in a directory that is not part of a Video Folder does not count toward these figures.
Unlocked Space: The amount of space occupied by recordings and clips that are expirable.
Locked Recording Space: The amount of space occupied by full-length recordings that are NOT expirable.
Locked Clip Space: The amount of space occupied by clips that are NOT expirable.
Average Duration Recorded per Day: Average number of hours based on completed recordings.
Total Duration Recorded: Sum of the durations of all items in the Library.
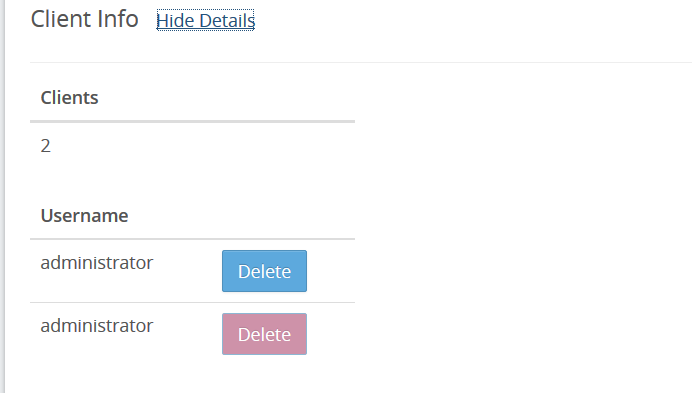
Client Info
This section lists all users who are currently connected to the server.Click Delete to disconnect the user forcibly.
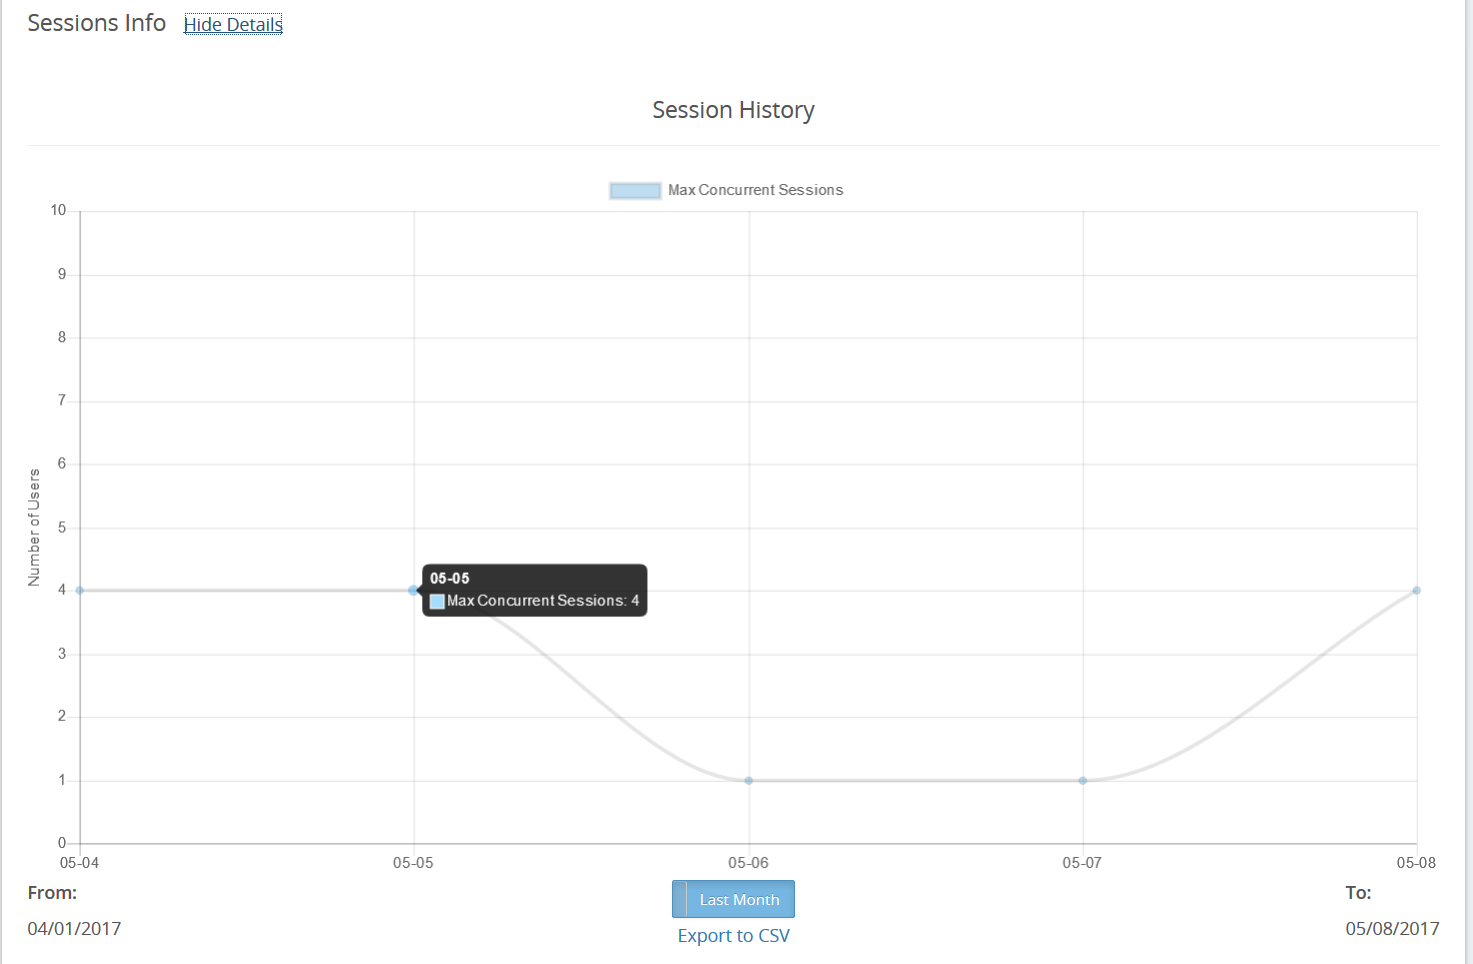
Sessions Info
This section displays historical information about users who have logged in to the system, shown as a line graph. Click the button below the graph to toggle between a view of the last month and year. Click Export to CSV to download this data in CSV format. Hover the mouse over a data point as shown to see the number of sessions for a specific day.
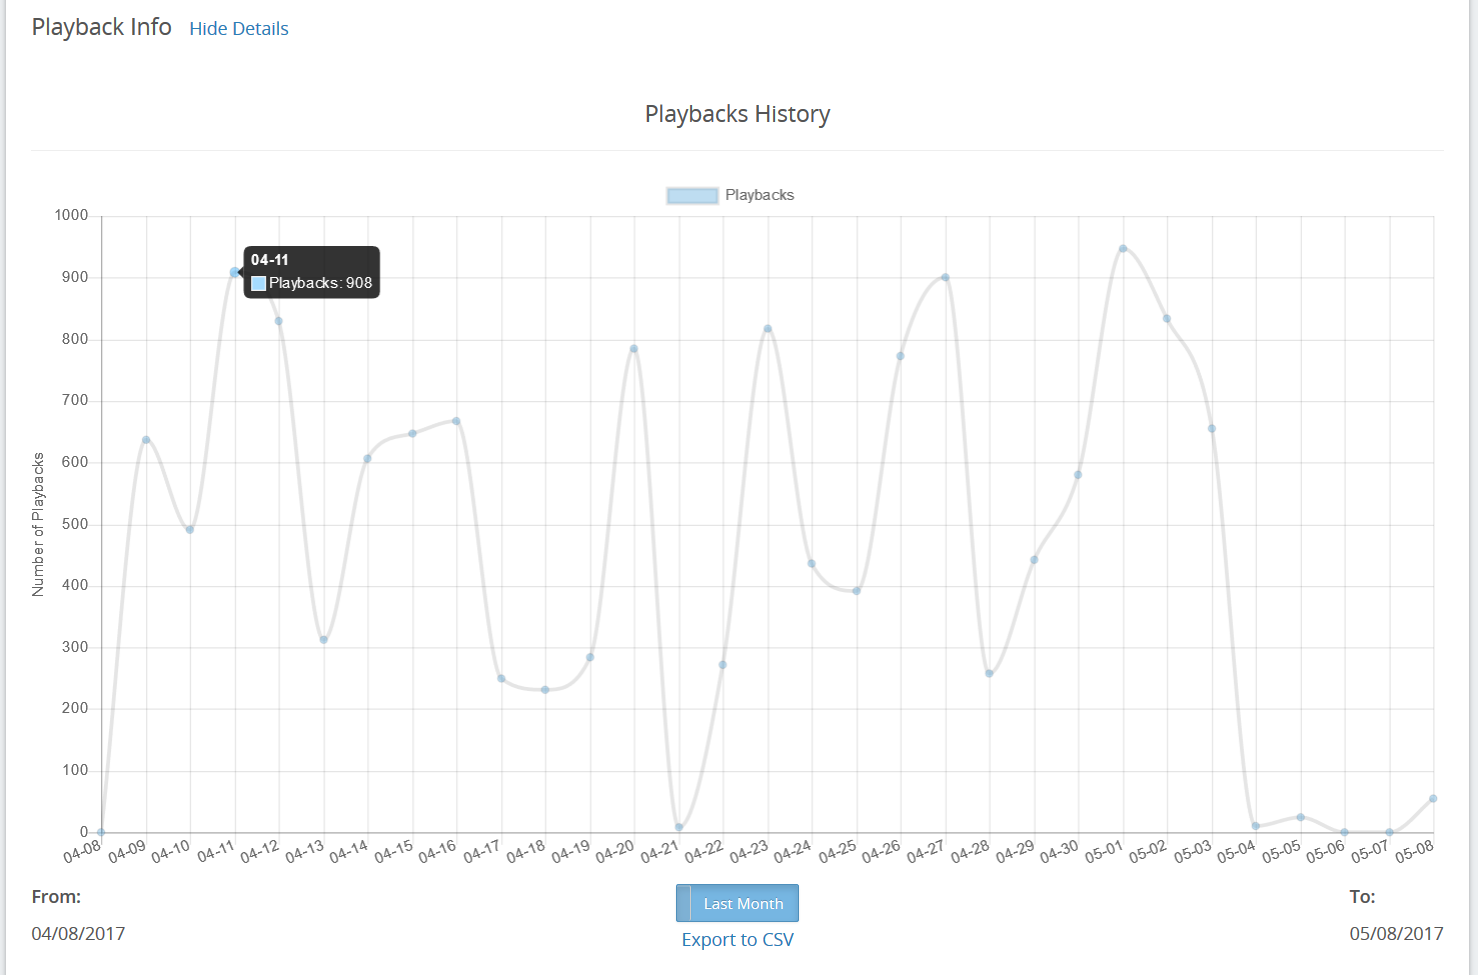
Playback Info
This section displays historical information about how many times users have played back video from SnapStream, shown as a line graph. Click the button below the graph to toggle between a view of thelast month and year. ClickExport to CSVto download this data in CSV format. Hover the mouse over a data point as shown to see the number of playbacks for a specific day.
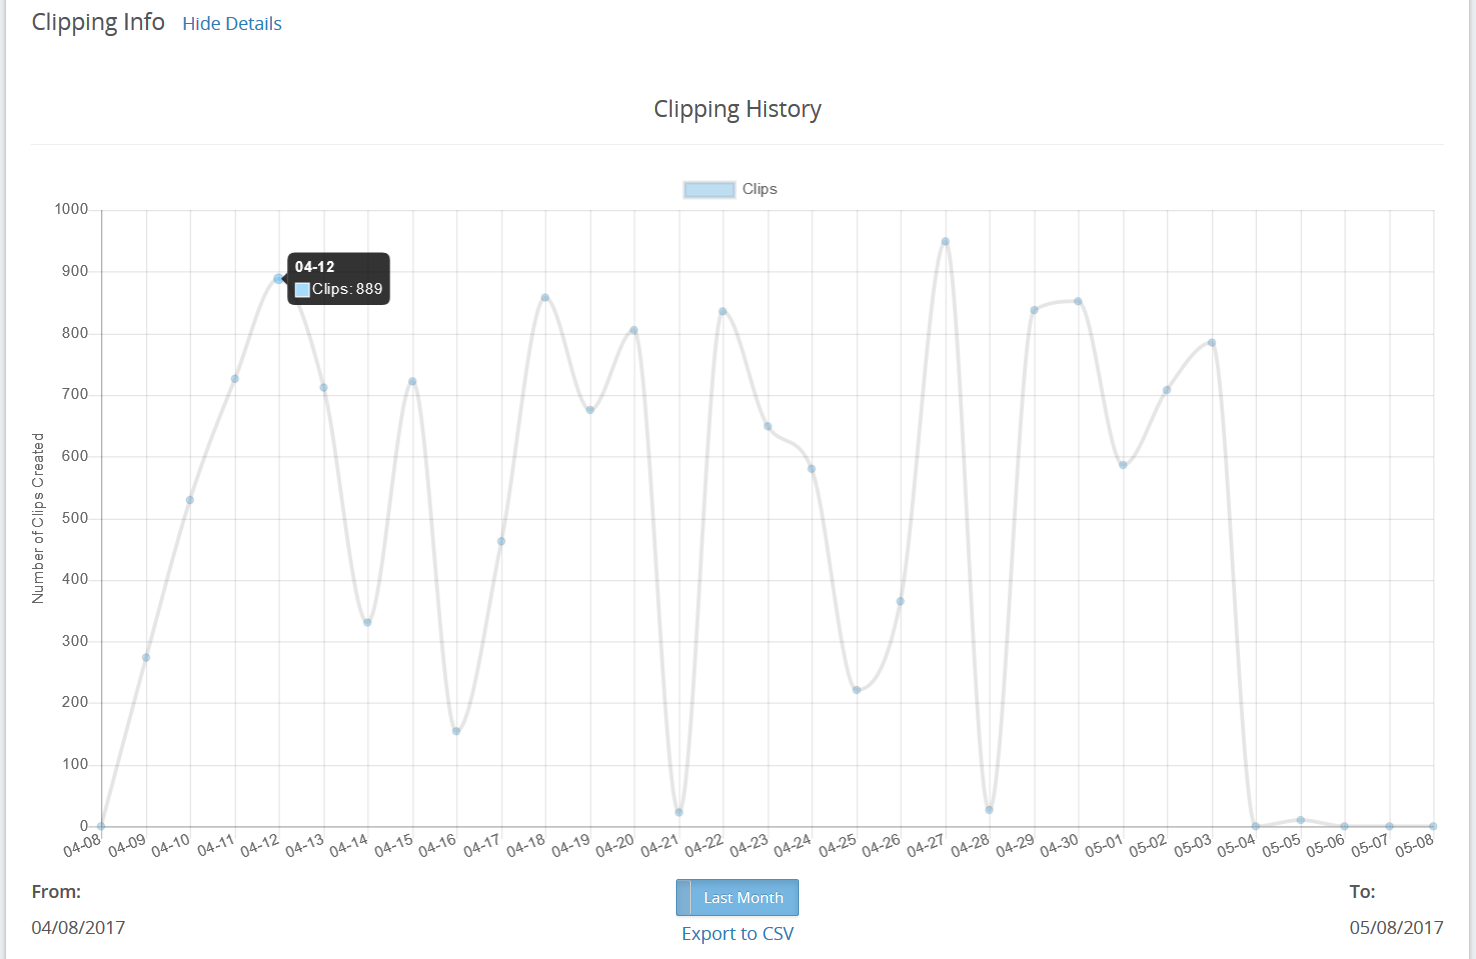
Clipping Info
This section displays historical information about how many times users have created clips using SnapStream, shown as a line graph. Click the button below the graph to toggle between a view of thelast monthandyear. ClickExport to CSVto download this data in CSV format. Hover the mouse over a data point as shown to see the number of clips for a specific day.
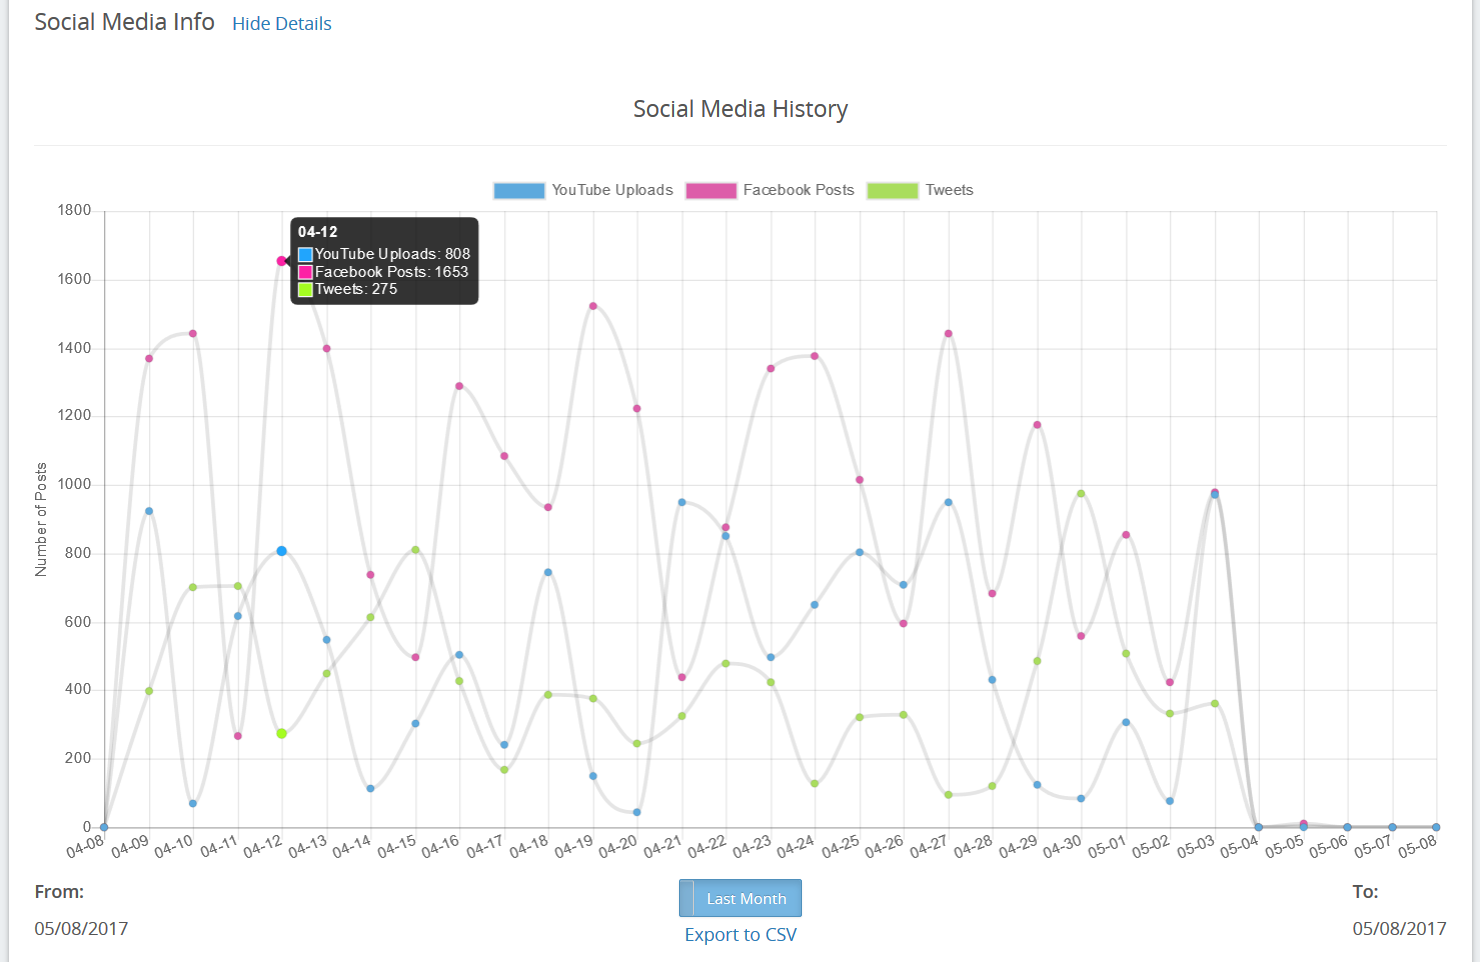
Social Media Info
This section displays historical information about how many times users have posted to Twitter, Facebook and YouTube using Snapstream, shown as a line graph. Click the button below the graph to toggle between a view of thelast monthandyear. ClickExport to CSVto download this data in CSV format. Hover the mouse over a data point as shown to see the number of uploads for a specific day.
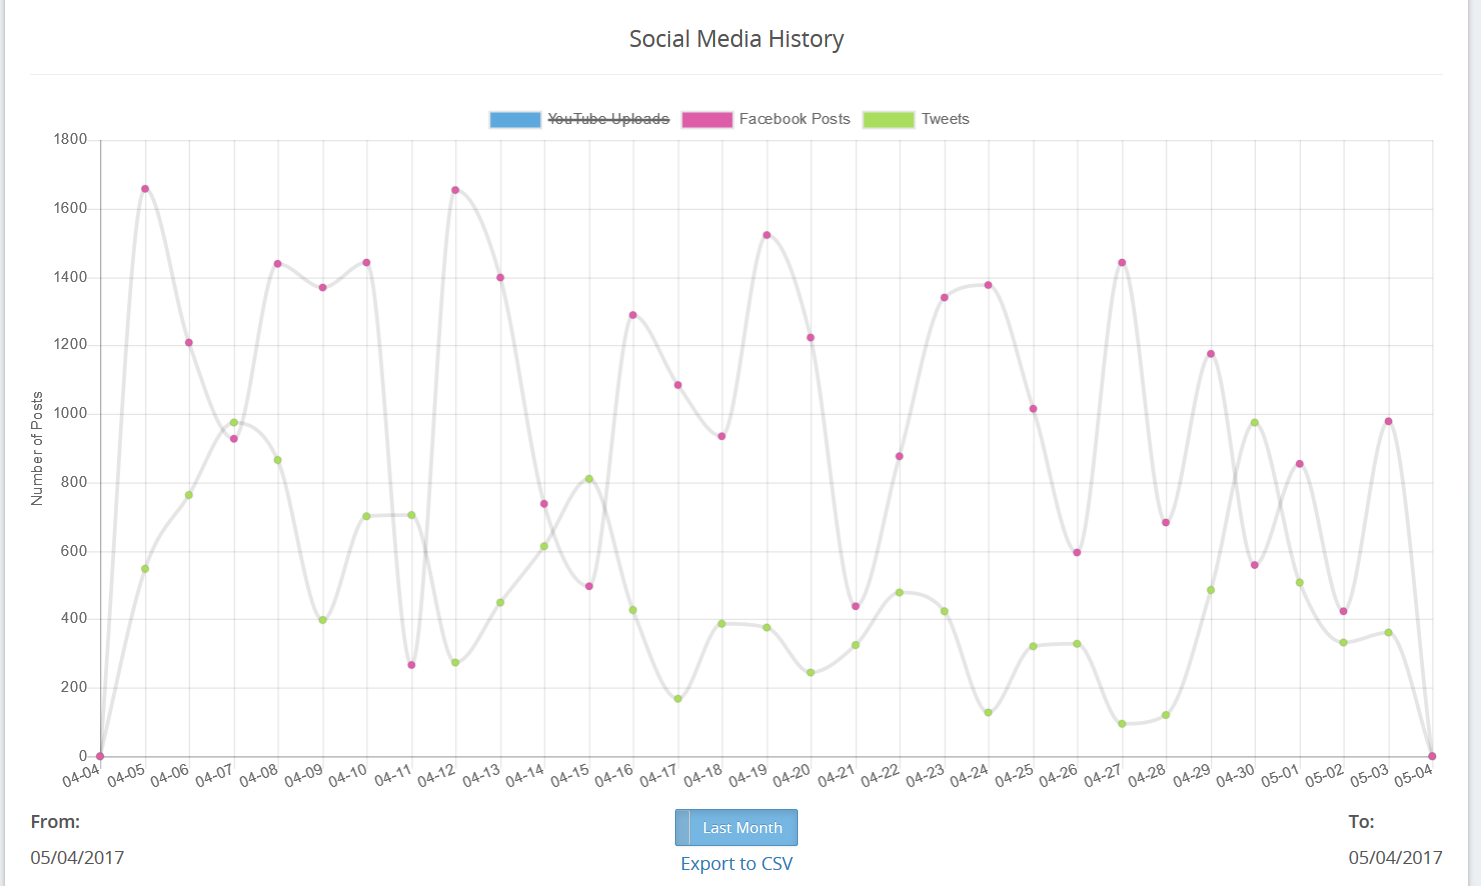
To hide any of the social media platforms from the graph, click on its name. Click it again to show it.
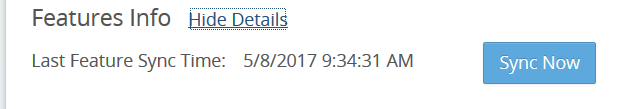
Features Info
This section displays the last time your system was synchronized with SnapStream.Net. This may determine whether you can add tuners or storage to your system. Contact SnapStream Support for more information.