The Analytics Report page provides detailed reporting about how your SnapStream system is being used.
By default, this page displays data about all actions that have been taken on the system by any user. This includes automated actions, such as scheduled recordings beginning and ending, the expiration of items from the Library, etc.
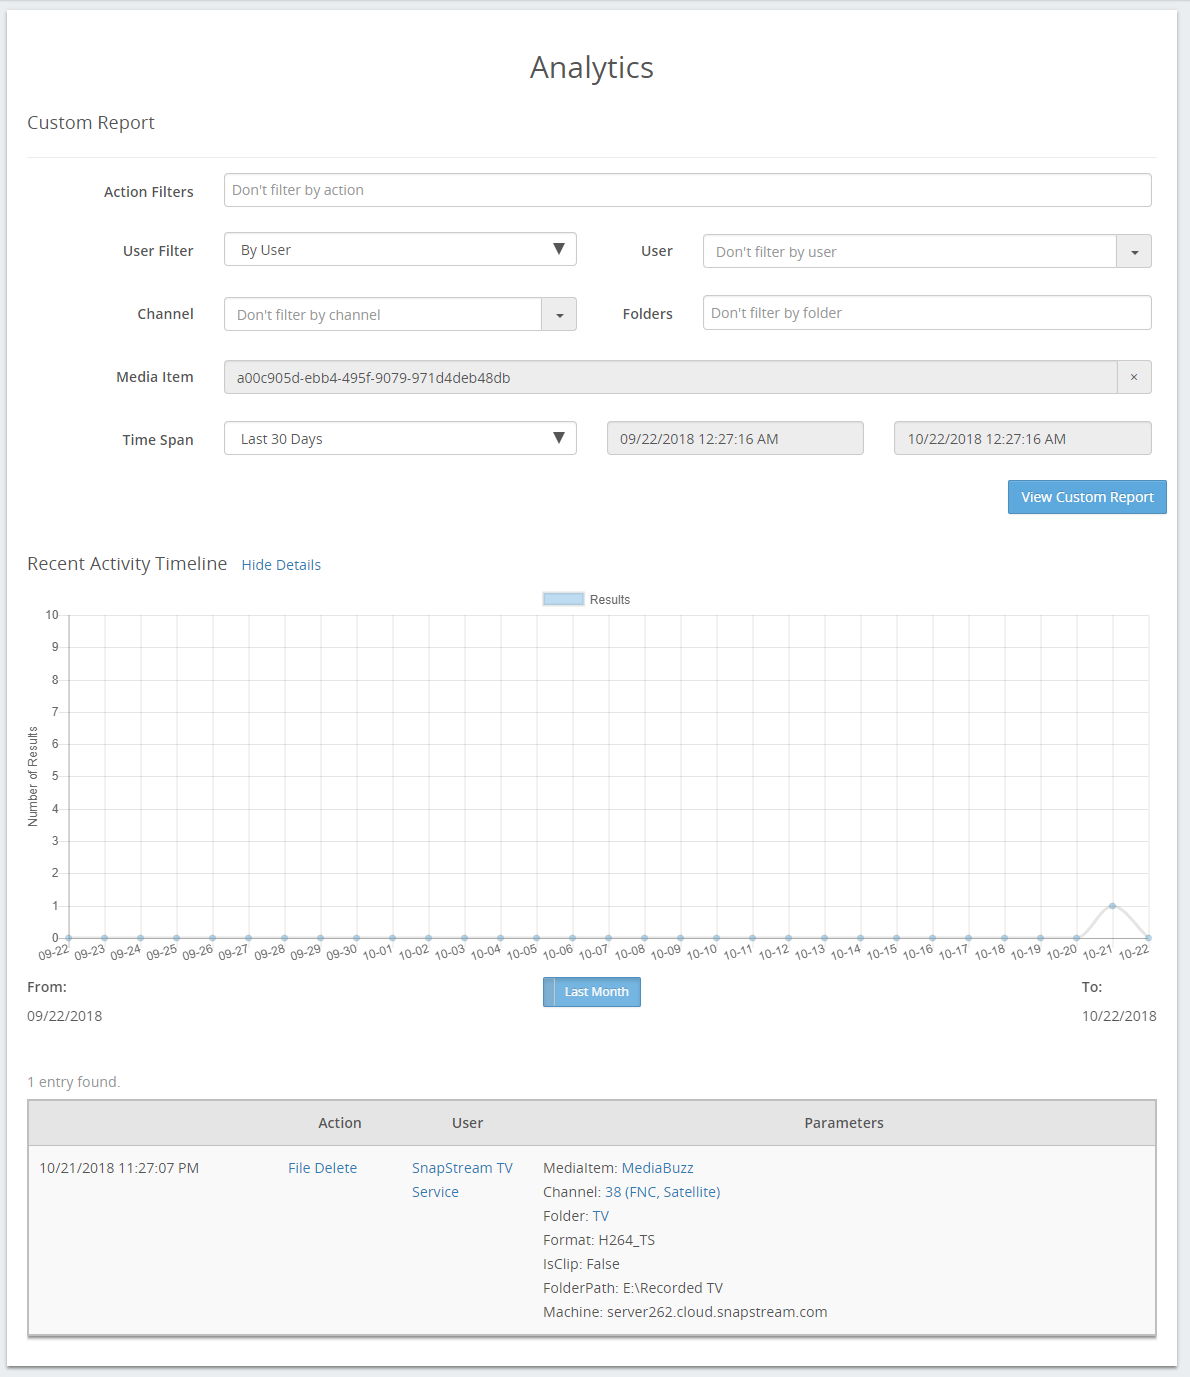
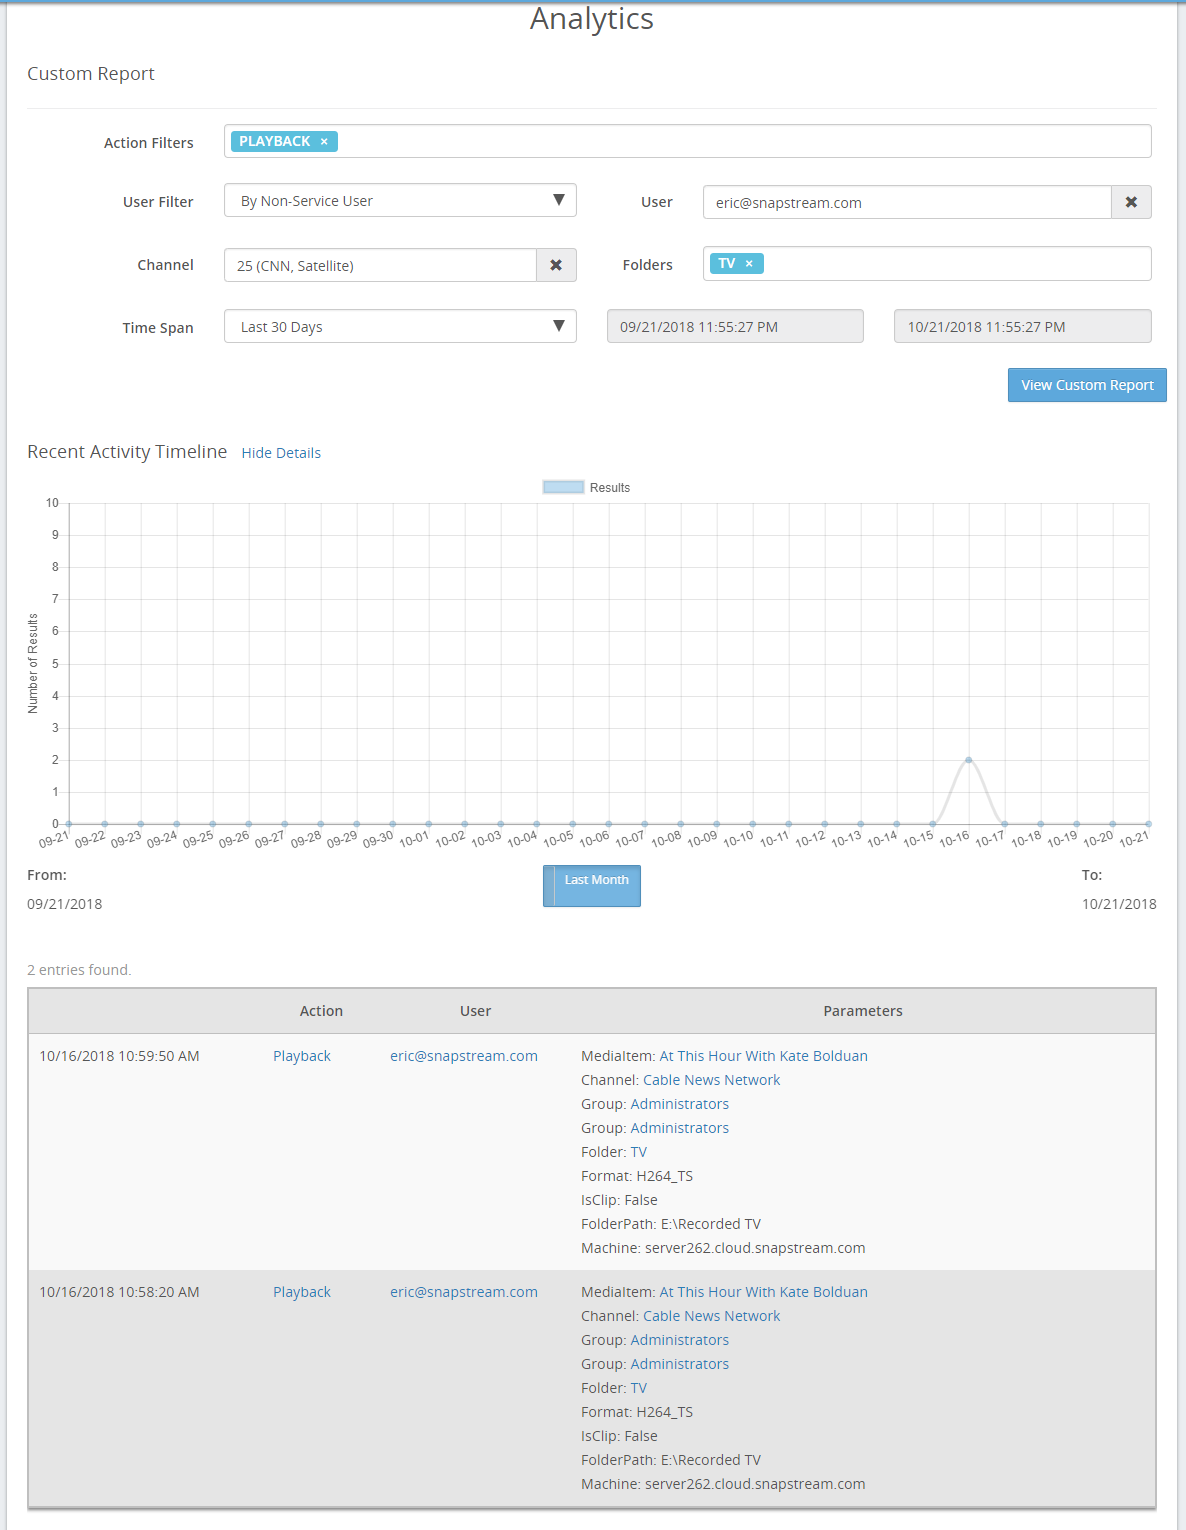
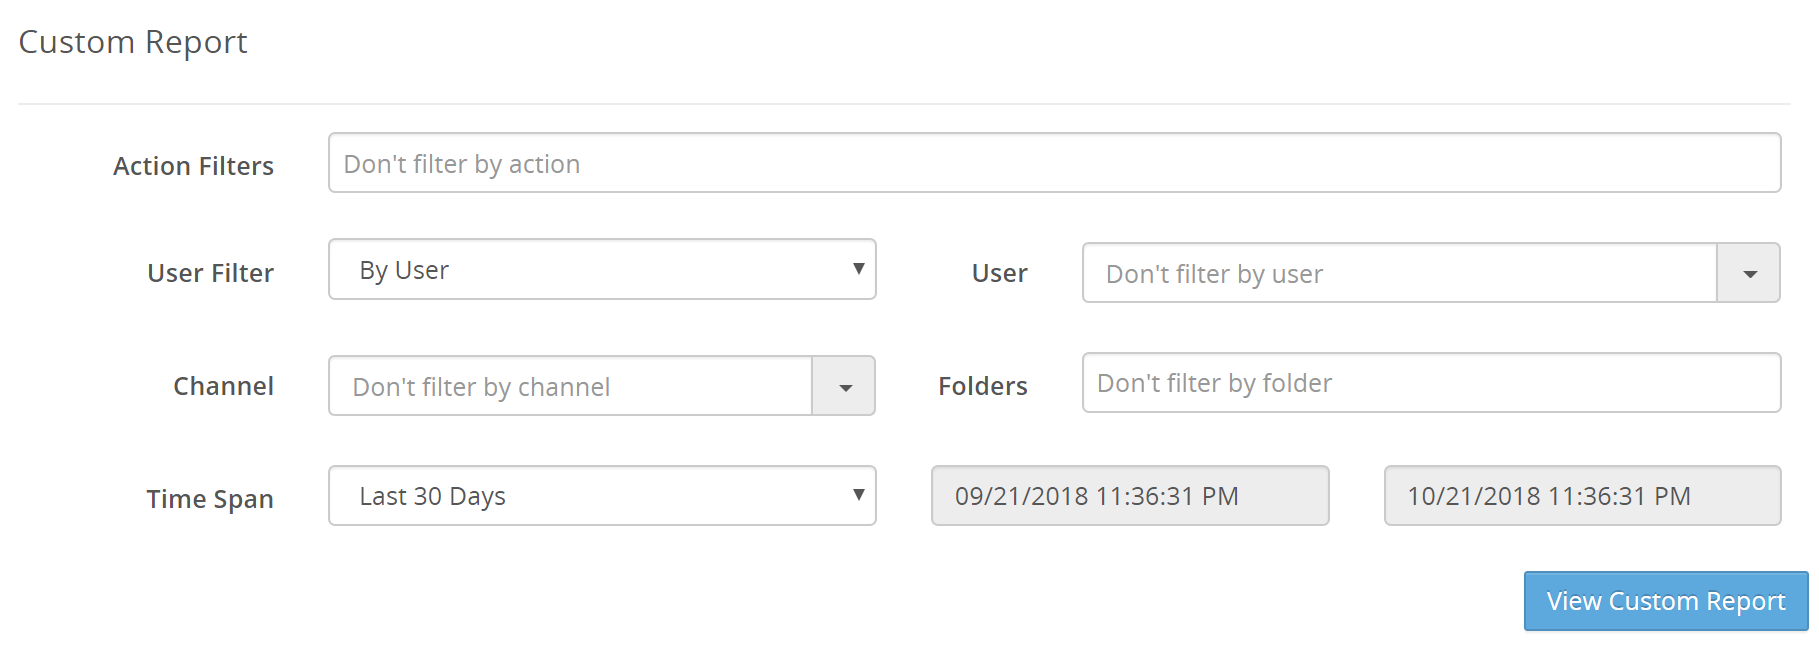
The Custom Report section allows you to filter the report in several different ways.
The Recent Activity Timeline is a line graph of actions performed on the system, filtered based on the settings in the Custom Report section.
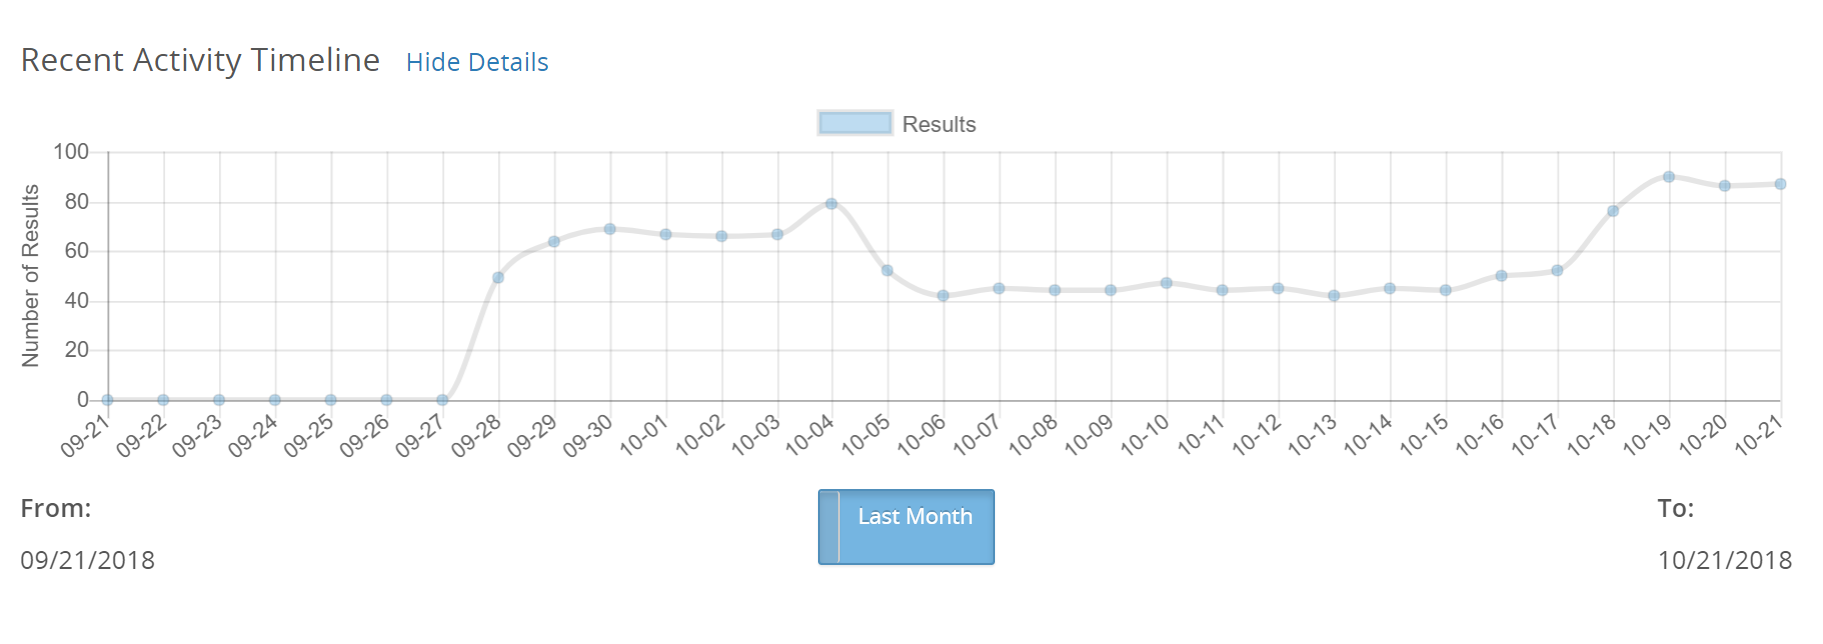
Click the button to toggle between viewing the most recent month and year.
Mouse over a point on the line to see the data for that date:
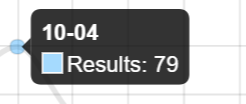
Or click the point to view actions for that date.
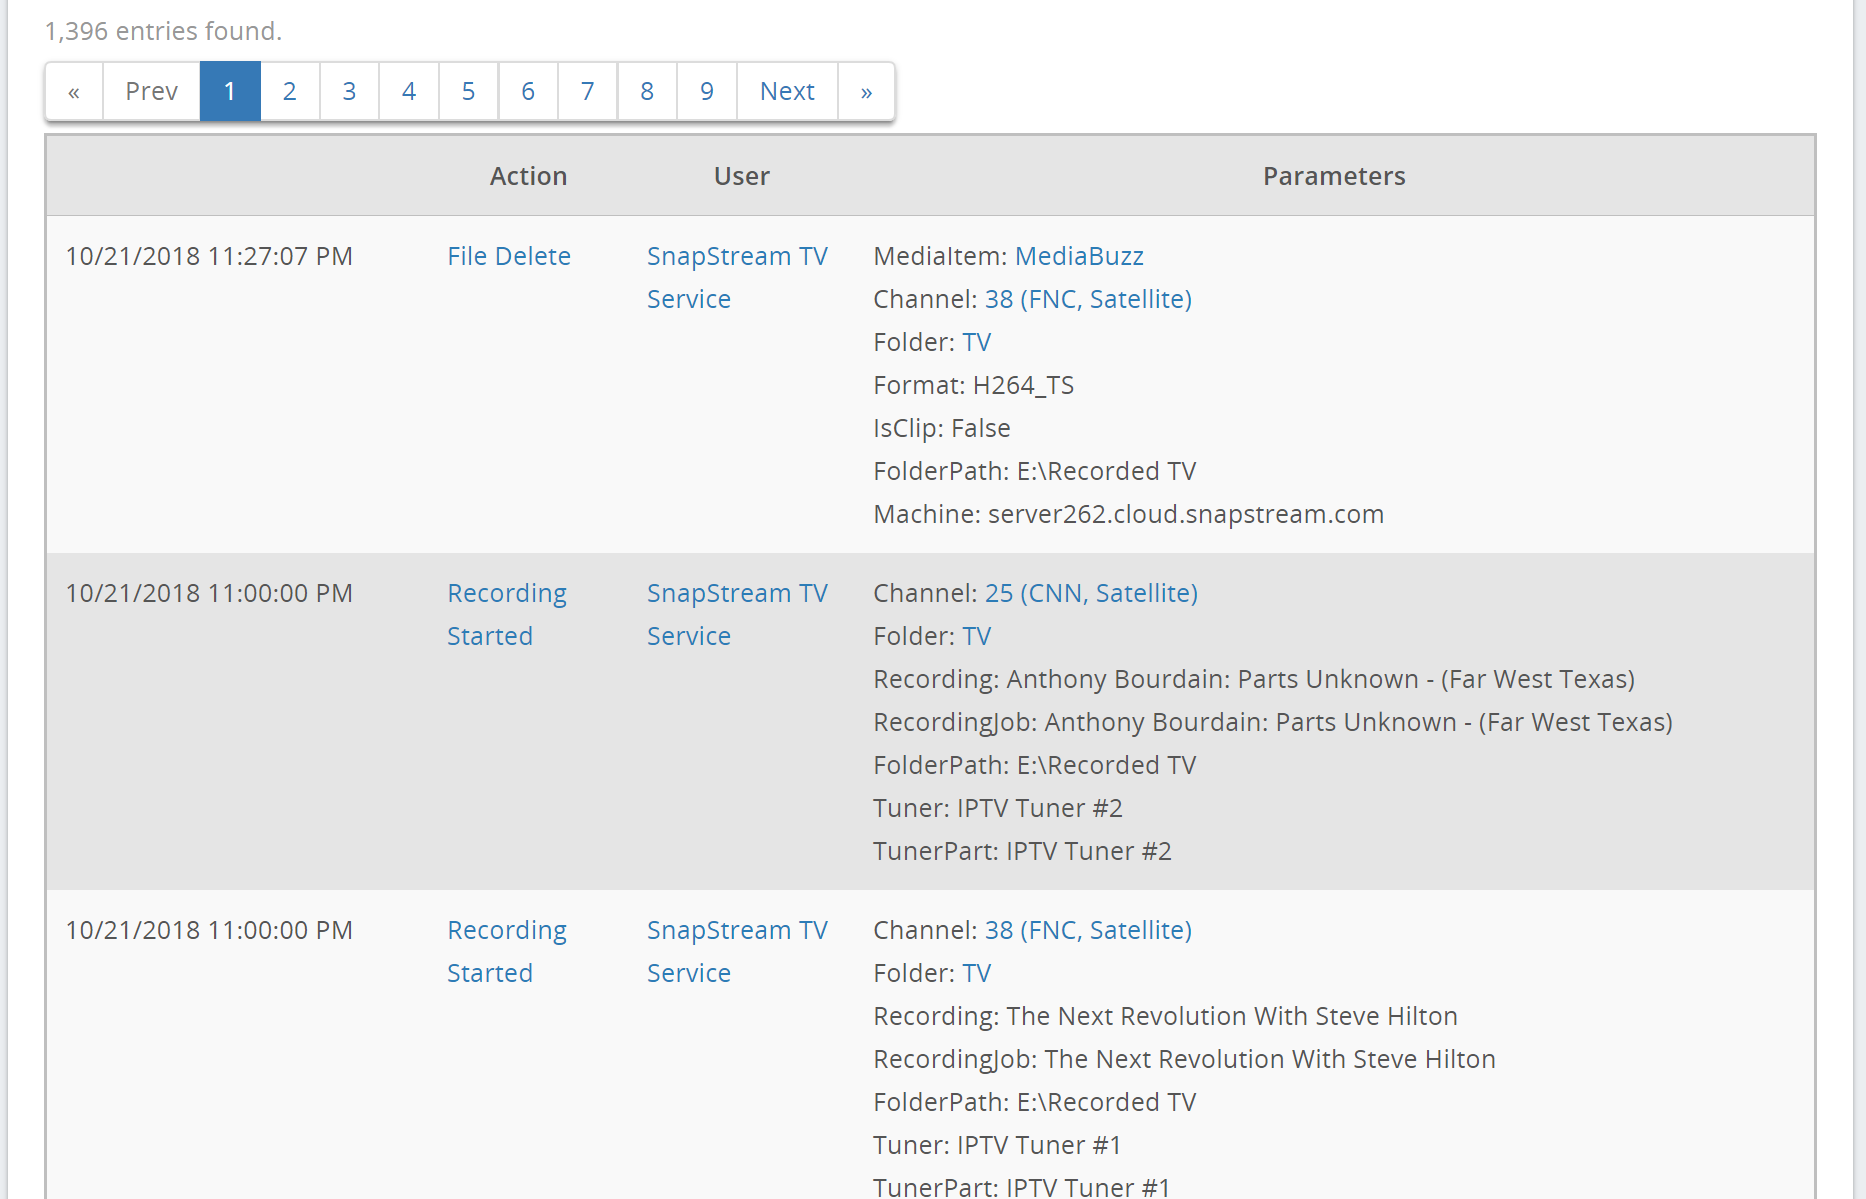
The log entries below the graph list actions that match the Custom Report filter settings above.
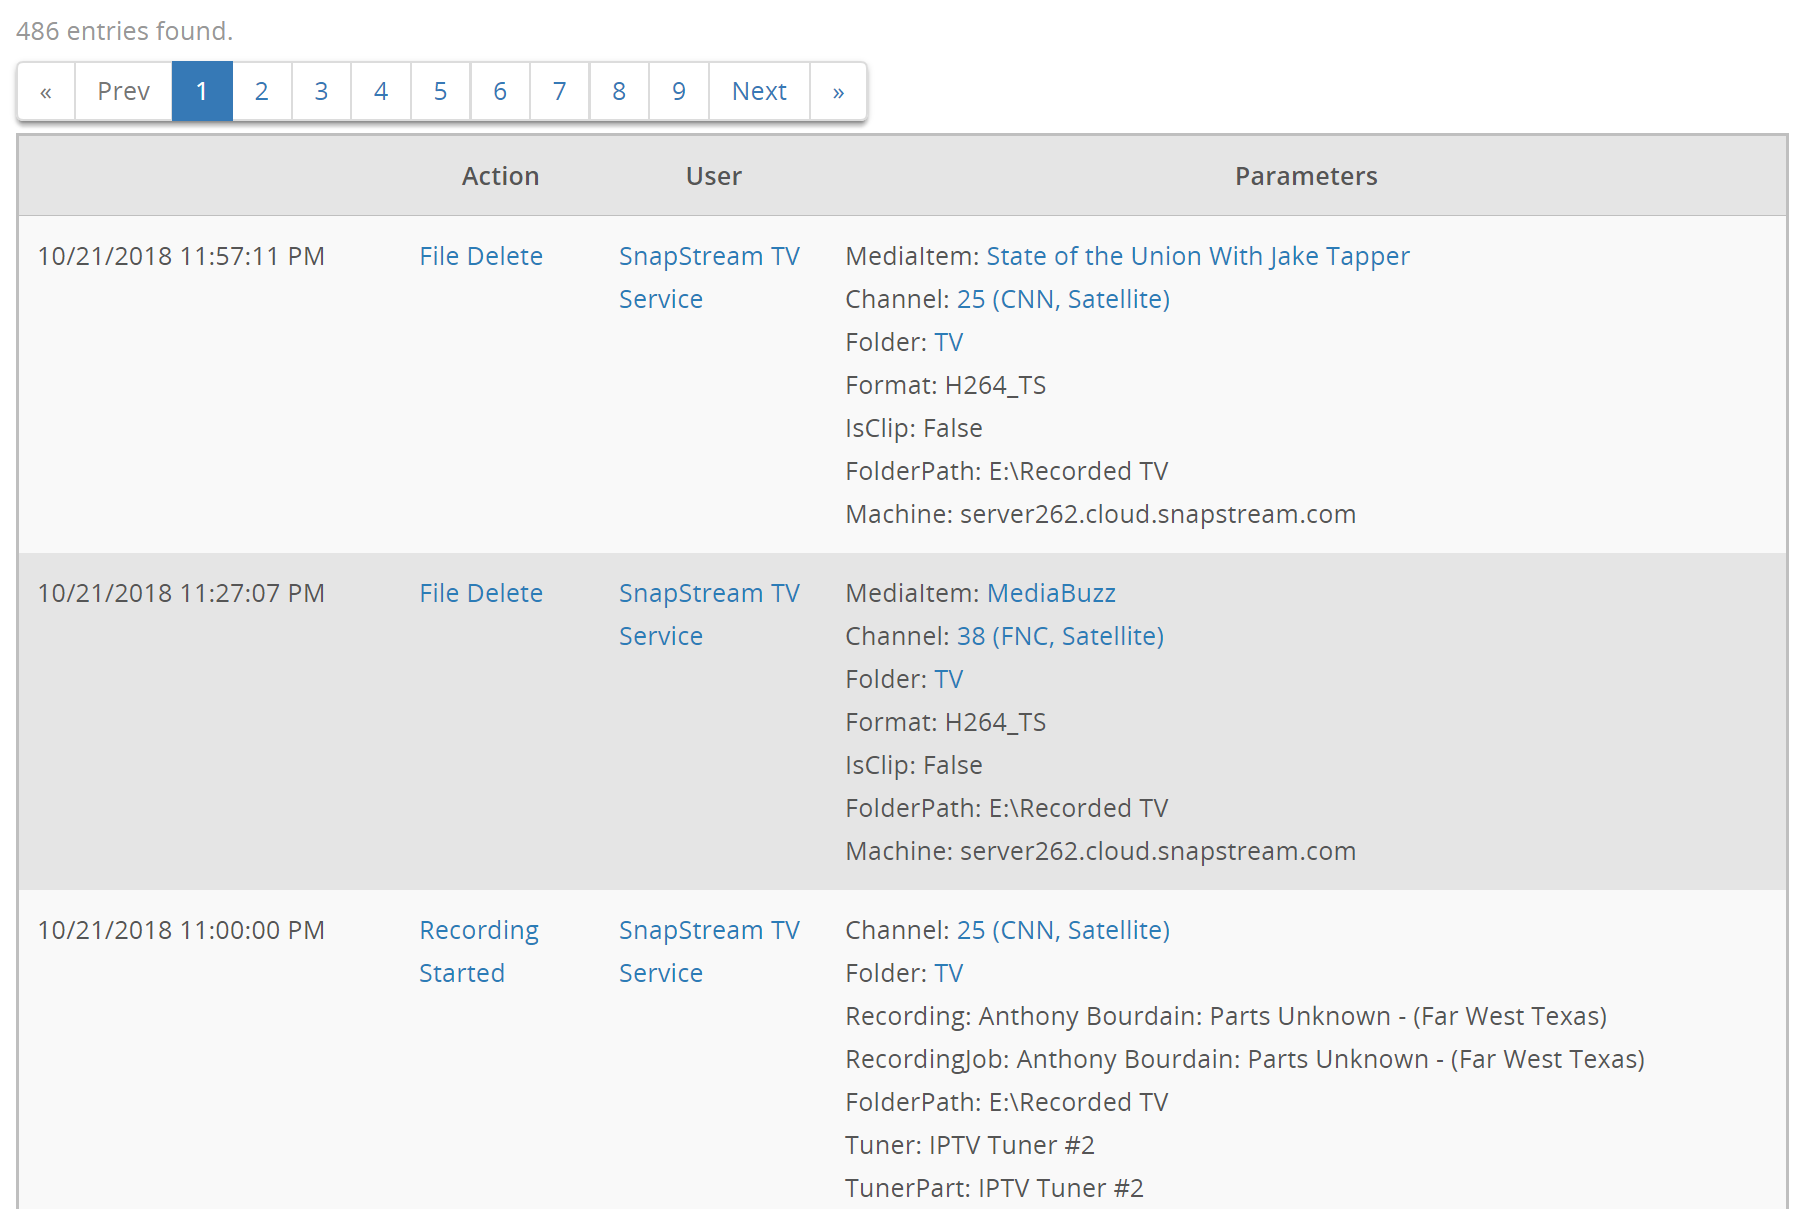
Click any of the items in blue to filter on that property. From the log entries, you can filter on a specific media item by clicking its name.